Dashboards

This document outlines the process of creating a dashboard in iVendNext, a retail management system. iVendNext dashboards integrate data from various sources and display it in an easily understandable format using Charts and Number Cards.
Introduction
A dashboard is a central interface that provides real-time insights and key metrics about business operations by consolidating data from various sources and presenting it in an easily digestible format.
 Each Dashboard consists of one or more than one Charts and Number Cards. These Charts and Number Cards are configured with a data source. Data Source is usually the Document Type that you select from the drop down list. POS Invoice is a good example of a data source.
Charts are visual representations of data that make it easier to understand and analyze key metrics such as sales trends, revenue, and inventory levels. These include bar charts, line graphs, pie charts, and more.
Number cards are visual elements that display key metrics or data points in a simple, easy-to-read format. These are designed to highlight important figures at a glance, making it easier for users to understand critical information.
Dashboard charts, and number cards visually present data, but they each do so in distinct ways and for different purposes. Some of the key differences between the two is depicted in the image below:
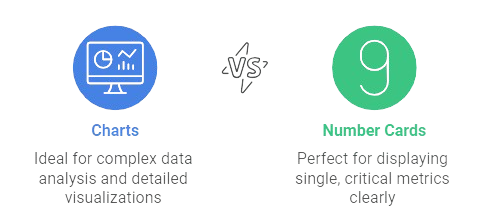
Both components are essential for a comprehensive dashboard, as they cater to different needs and help users quickly grasp detailed trends and key metrics.
The image below depicts a Stock Dashboard:

Steps to create a Dashboard in iVendNext
The steps to create a dashboard in iVendNext are summarized below:
Access the Dashboard Module
Create a New Dashboard
Add Dashboard Charts
Configure Chart Details
Set Chart Filters
Add Number Card
Configure Number Card
Set Number Card Filters
Save and Add Number Card to the Dashboard
Save and View the Dashboard
Access the Dashboard
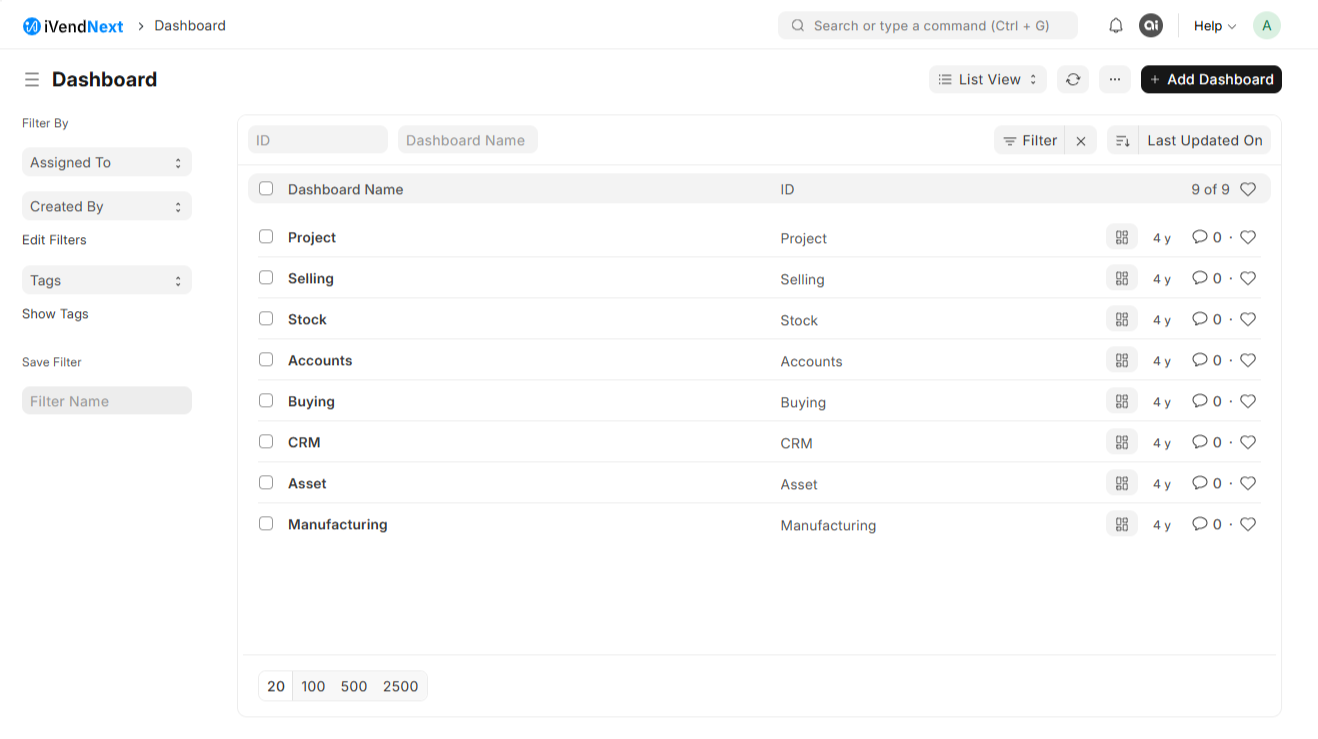
Navigate to Home > Retail. Then under the Quick Access Section click on the Dashboards shortcut. This will take you to the Dashboard List View Screen.
Create a New Dashboard
Click the Add Dashboard button. This will take you to the New Dashboard Screen. Enter a name for your dashboard and select the module(s) you want to track data from.

Add Dashboard Charts
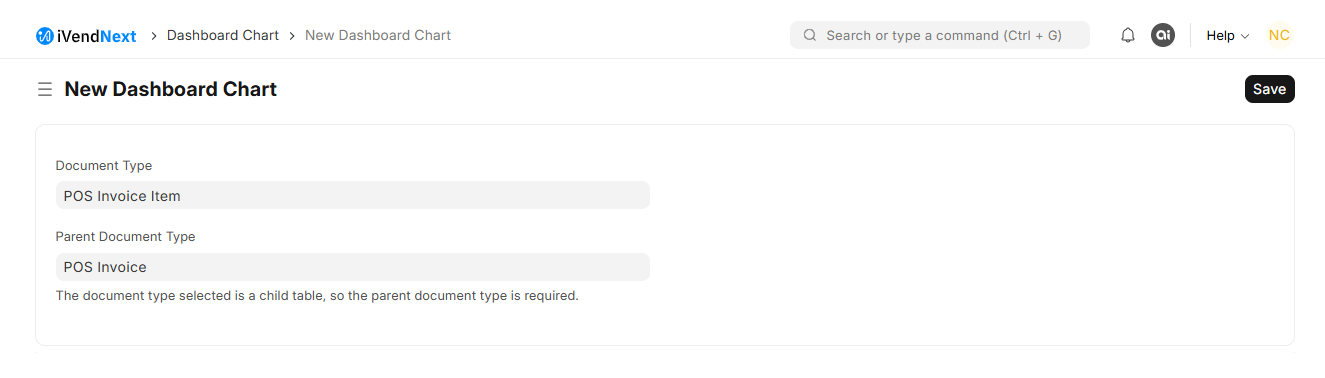
Add a row in the Charts Table. Select the Chart Type value from the drop down list or click the Create a New Dashboard Chart to create one. Then configure the data source. Data Source is usually the Document Type that you select from the drop down list. For Example POS Invoice. You can also use existing reports or create custom data sources.
You can select any one of the below values for the Chart Type:
Count
Sum
Average
Group By
Custom
Report
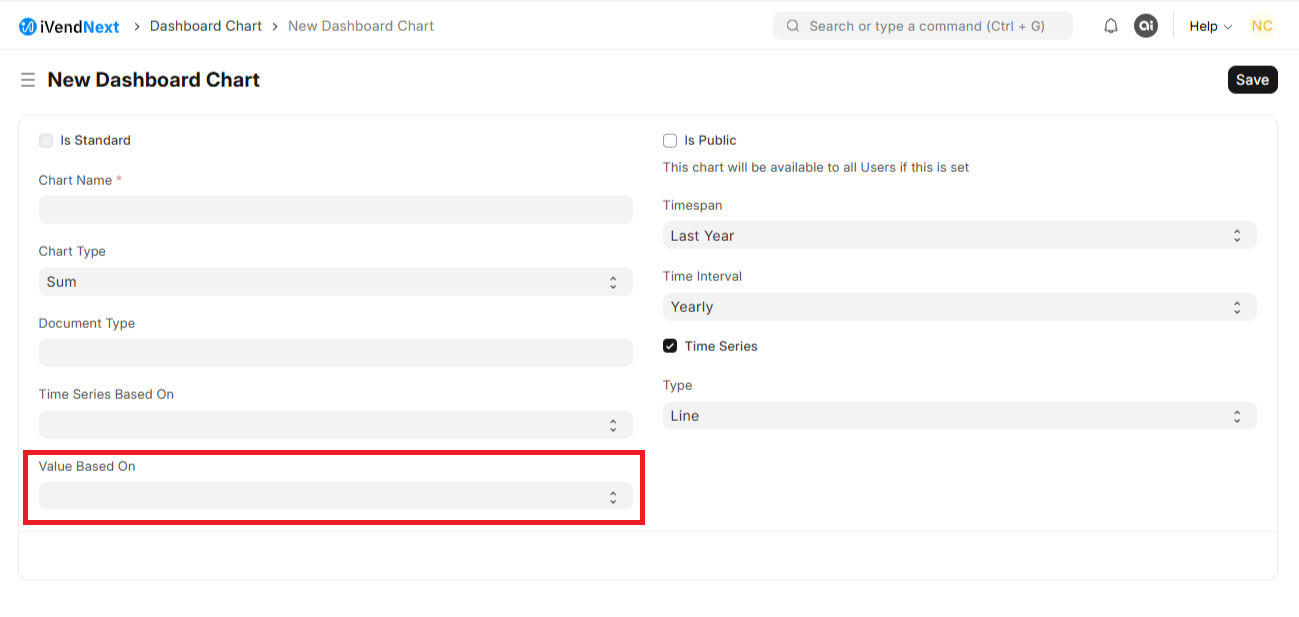
If you select Sum and Average as the Chart Type value, you will also have to select the Value Based On field.
If you select Group By as the Chart Type value, you will also have to select the Group By Type, Group By Based On, and Number of Groups fields.


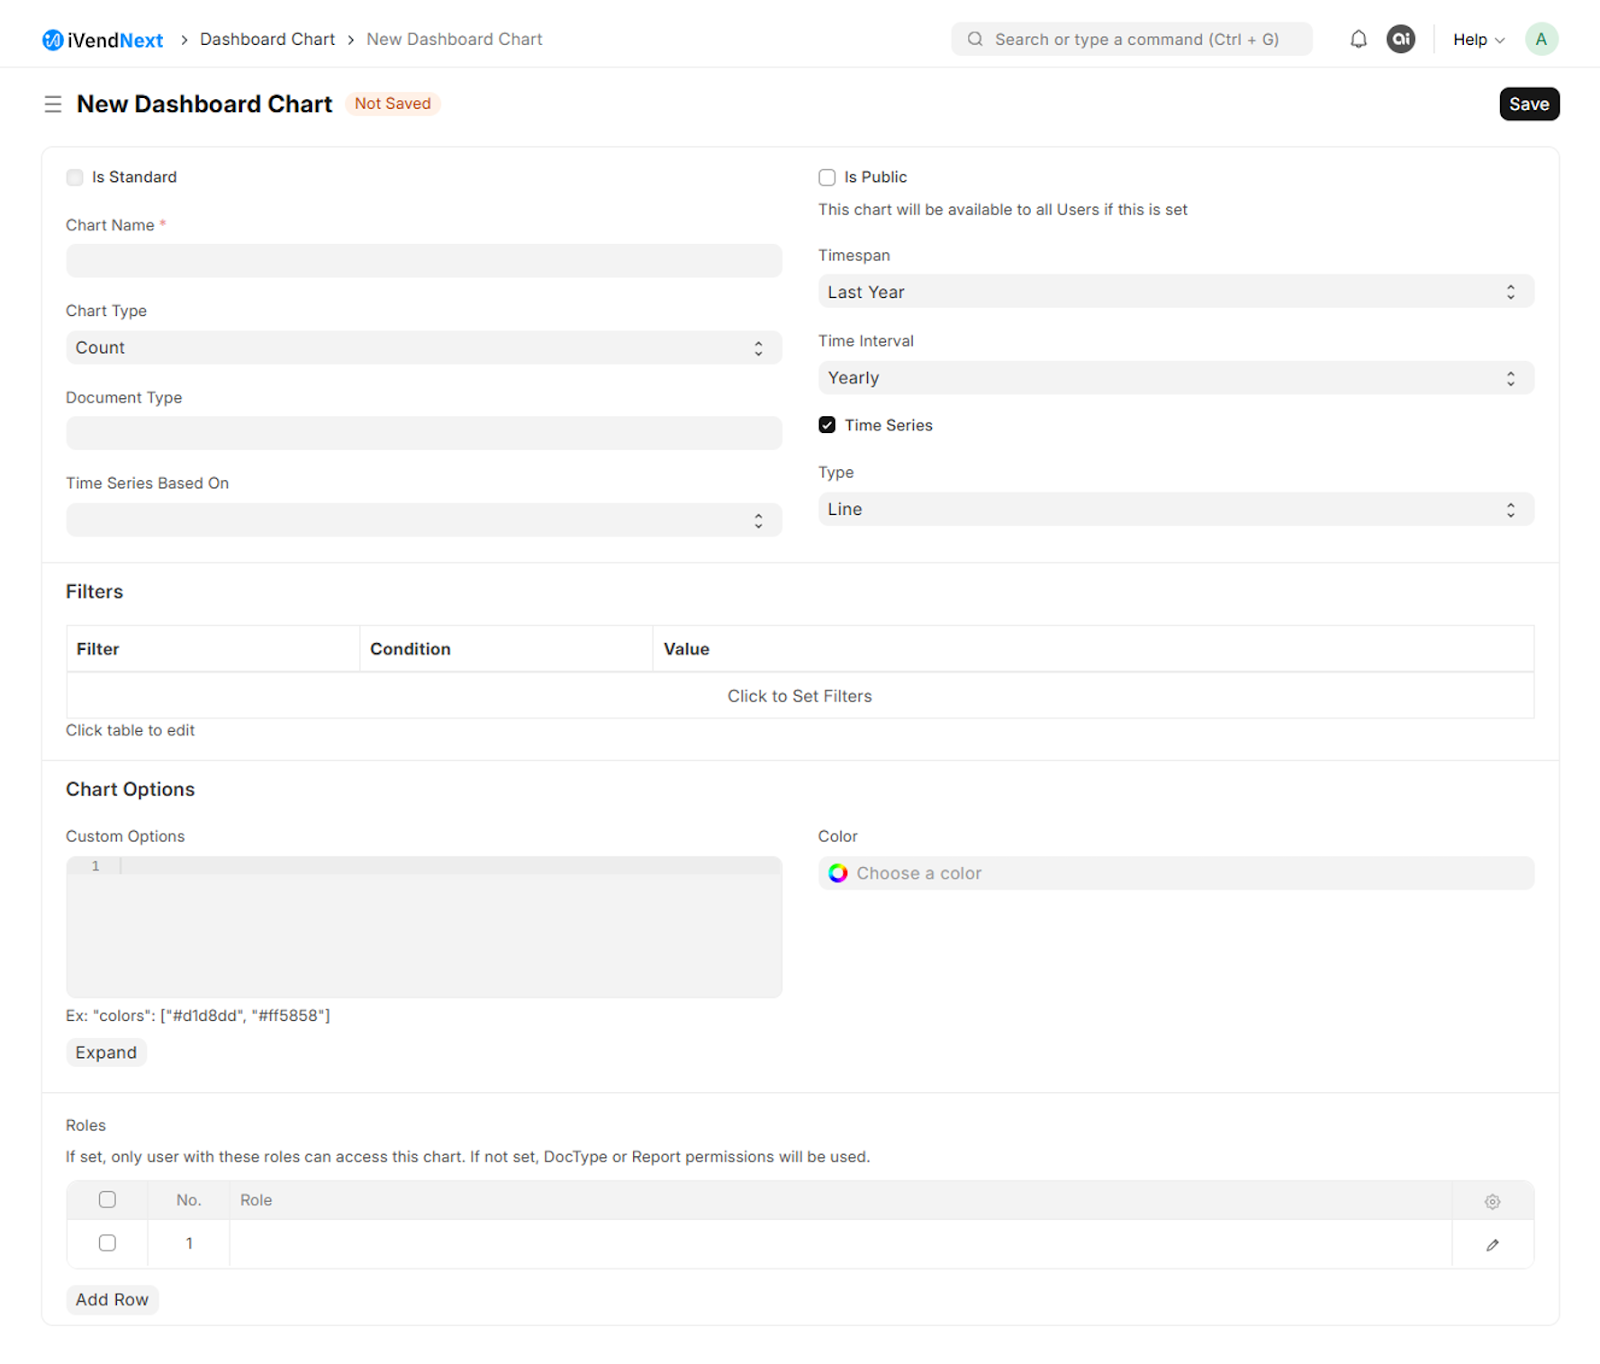
Configure Chart Details
Provide the Chart Name. This name will appear as the chart label. Then set the Chart Type (e.g., Count, Sum, Average, Group By). You will have to select the Dashboard Chart Source as the data source for the chart and configure any necessary filters to refine the data displayed.
 You can make use of the Time Series field to create charts that display data over a period of time. For time series data, you typically choose options like line charts or bar charts that can effectively represent data across different time intervals.
Set Chart Filters
You can use the Set Filters option to change the filters and refine the data displayed in the Chart. The chart will be refreshed automatically according to the newly set filters.
Create a New Number Card
You can Add a Number Card using the Cards Section on the New Dashboard Screen.
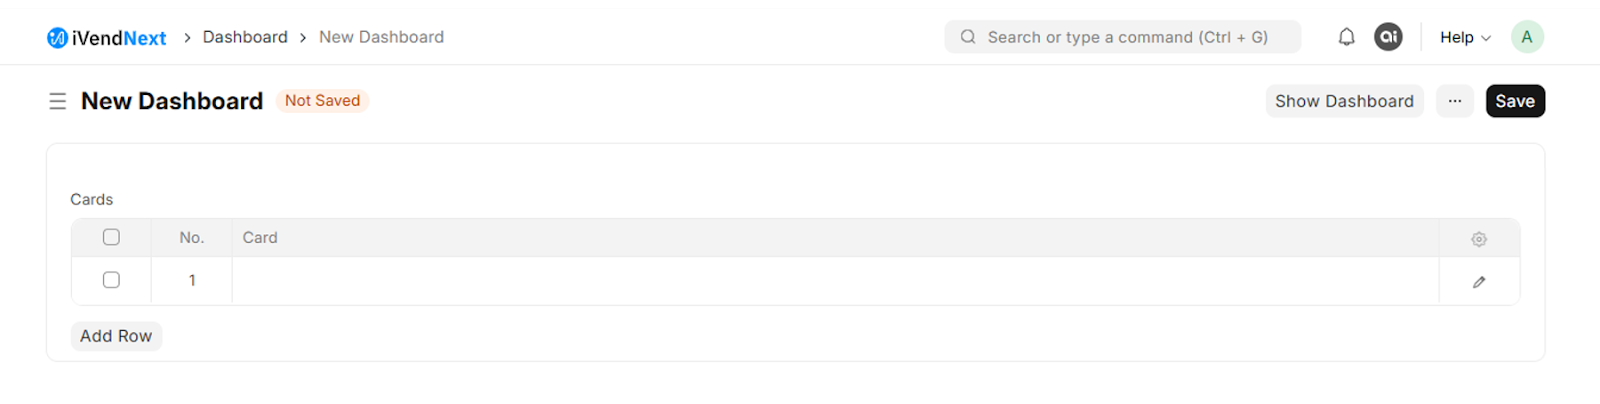
Add a row in the Cards Table. This will allow you to Add a Number Card in your dashboard. Click on the Create a new Number Card option. This will take you to the New Number Card Screen.
Configure the Number Card
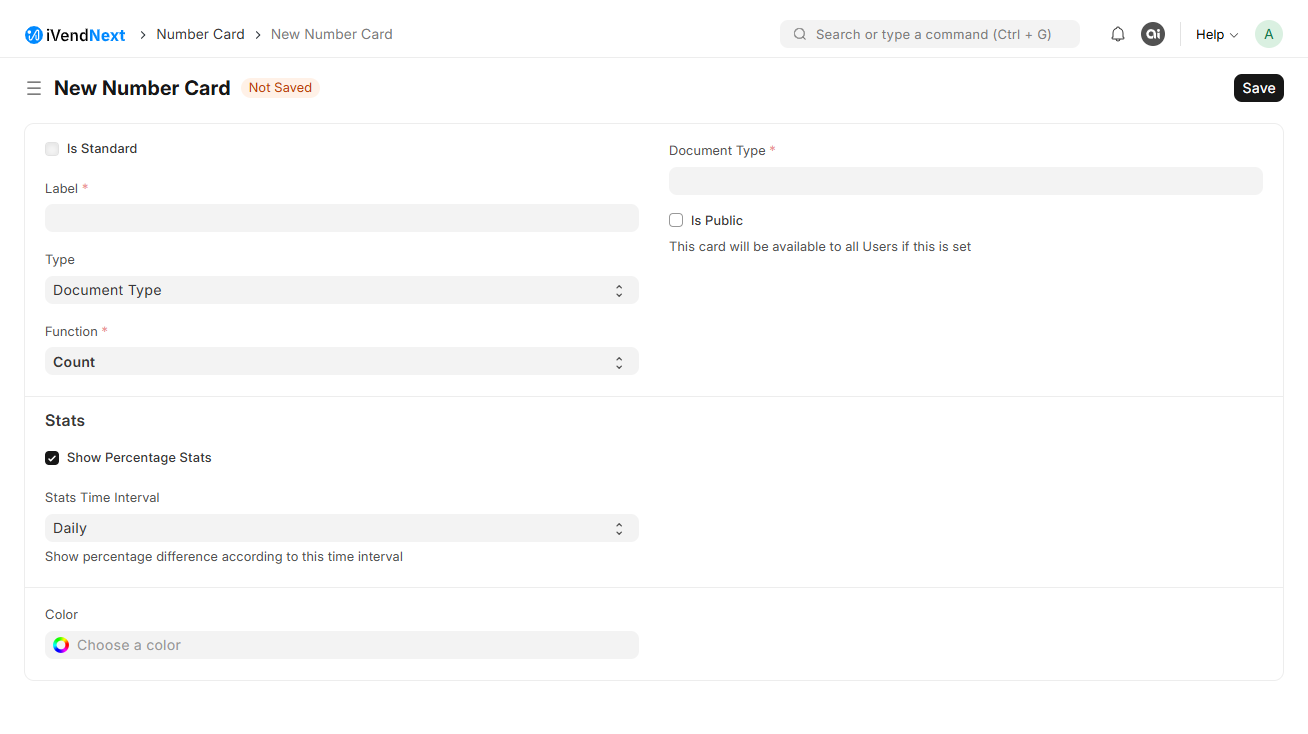
Select the document type you want to base the number card on (e.g., Sales Invoice, Purchase Order). Then choose the aggregation function (e.g., Count, Sum, Average) that will be applied to the data. You can select the specific field you want to aggregate (e.g., total amount, quantity).
Set Number Card Filters
You can add filters to refine the data displayed on the number card. For example, you might filter sales invoices by date range or customer.
Save and Add to Dashboard
Save the Number Card. Return to your dashboard and add the newly created Number Card to it.
Save and View the Dashboard
Save your changes. You can click on Show Dashboard to view the dashboard with the configured charts.
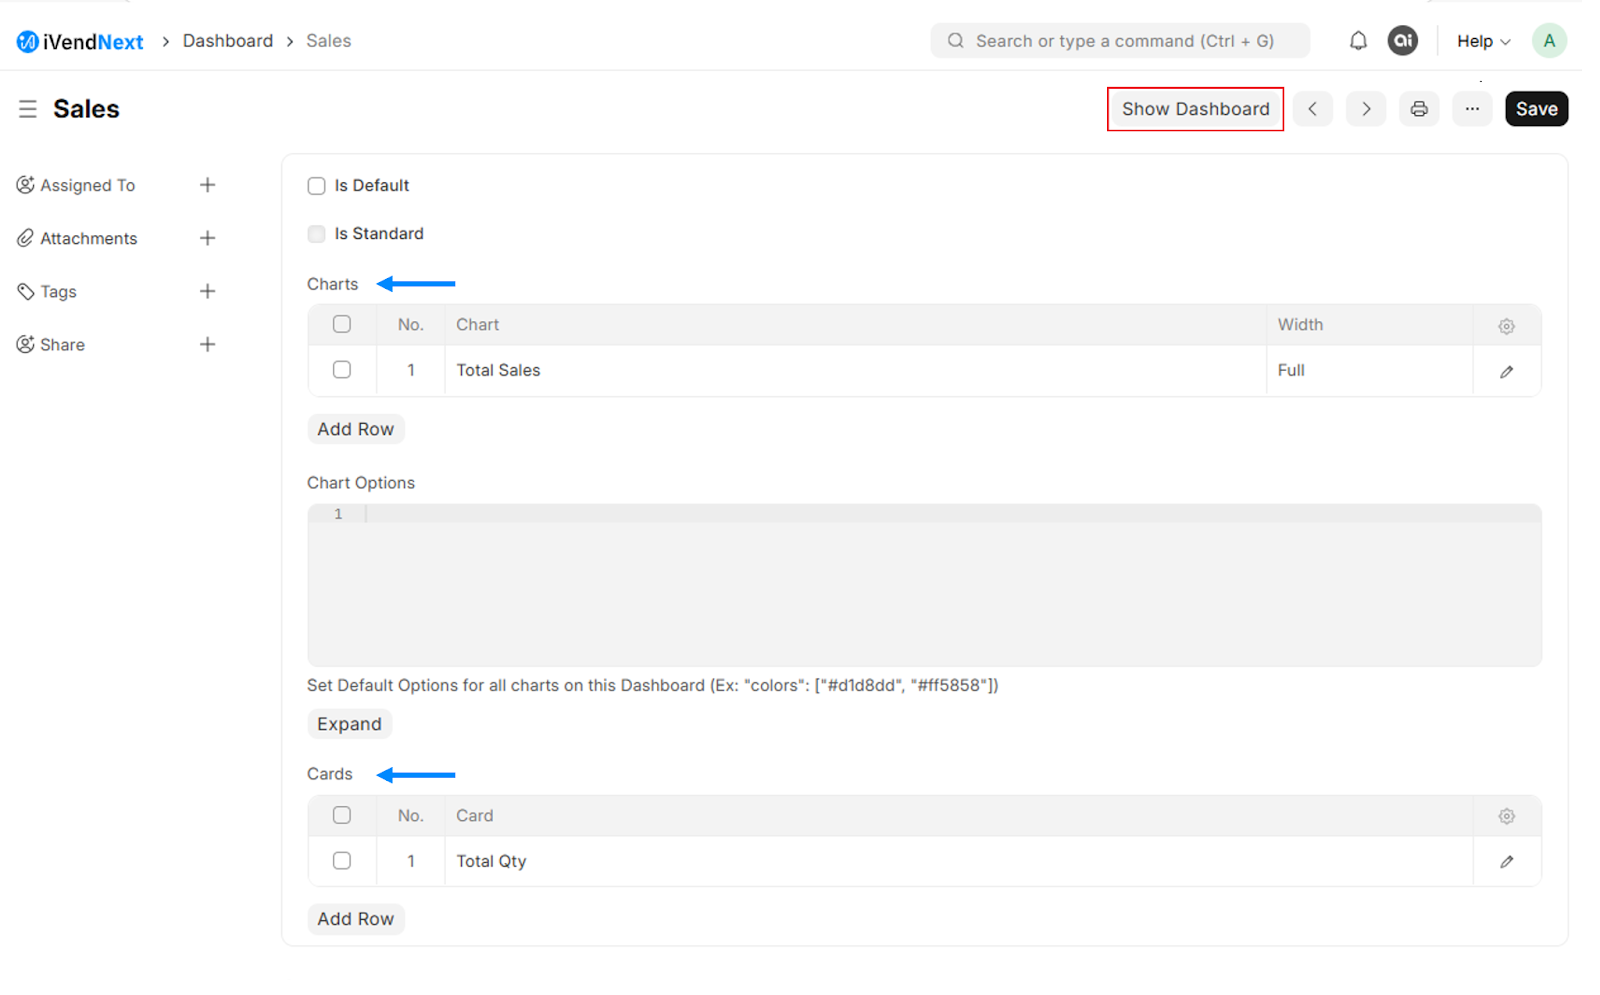
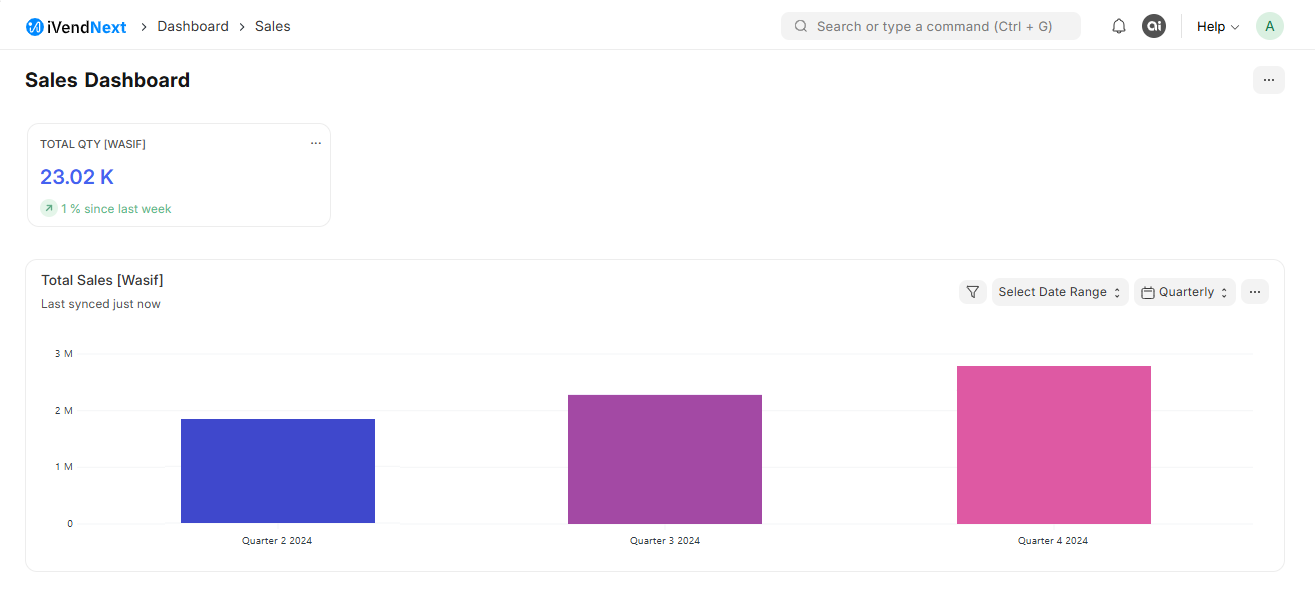
The image below depicts a Sales Dashboard:

Refresh Data: Ensure your dashboard displays the most recent data by using the Force Refresh option if needed.
By following these steps, you can create a customized dashboard in iVendNext that provides real-time insights and key metrics tailored to your business needs.
Combining Charts and Number Cards to Create a Dashboard in iVendNext
Dashboards in iVendNext allow you to combine multiple charts and number cards to provide a comprehensive view of your business metrics. You can customize your dashboard in iVendNext. This will allow you to tailor the Dashboard to your specific needs and preferences.
Some ways to further customize your dashboard are listed below:
1. Adding or Removing Charts and Number Cards
Add New Elements:
You can add new charts and number cards to your dashboard by navigating to Home > Retail > Dashboards. Then click on "Add Chart" or "Add Number Card" to include new elements.
Remove Elements:
To remove an existing chart or number card, simply click on the delete icon next to the element you want to remove.
2. Customizing Layout
Drag and Drop:
Rearrange the charts and number cards by dragging and dropping them into your preferred positions. This helps you organize the dashboard in a way that makes the most sense for your workflow.
Resize Elements:
Adjust the size of each chart or number card to emphasize the most important data. This can be done by dragging the corners of the elements.
3. Setting Filters and Parameters
Dynamic Filters:
Customize the data displayed in your charts and number cards by setting filters. Click on the filter icon and choose the criteria that best suit your needs, such as date ranges, specific fields, or aggregation functions.
Parameterization:
Use parameters to dynamically change the data source or the way data is aggregated. This allows you to view different aspects of your data without creating multiple charts.
4. Using Custom Scripts
Script Reports:
For more advanced customization, you can use custom scripts to create dynamic and complex reports. This requires knowledge of Python and iVendNext's scripting capabilities.
Custom Dashboards:
Create entirely custom dashboards using iVendNext's API and scripting tools to pull data from various sources and display it in unique ways.
5. Personalizing the Workspace
Shortcuts and Links:
Add shortcuts to frequently used reports or modules directly on your dashboard for quick access. This can be done by clicking on the "Customize" button at the top right corner of your workspace.
Themes and Colors:
Customize the look and feel of your dashboard by changing themes and colors to match your brand or personal preference.
6. Saving and Sharing Dashboards
Save Custom Dashboards:
Once you have customized your dashboard, save it for future use. You can create multiple dashboards for different purposes or departments.
Share with Team:
Share your customized dashboards with team members to ensure everyone has access to the same insights and data.
By leveraging these customization options, you can create a dashboard in iVendNext that is both functional and visually appealing, tailored to your specific business needs.
iVendNext Dashboard - Key Components
A iVendNext dashboard typically includes several key components. Some of the main components are listed below:
Charts and Graphs:
Visual representations of data such as sales trends, revenue, and inventory levels. These can include bar charts, line graphs, pie charts, and more.
Tables and Grids:
Detailed data presented in a tabular format, allowing for easy comparison and analysis of metrics like sales by product, employee performance, and customer demographics.
KPIs (Key Performance Indicators):
Specific metrics that are critical to the success of the business, such as total sales, average transaction value, and customer retention rates.
Filters and Controls:
Tools that allow users to customize the data displayed on the dashboard, such as date ranges, product categories, and store locations.
Alerts and Notifications:
Real-time alerts for important events, such as low stock levels, high sales volumes, or system errors.
Interactive Elements:
Features that allow users to drill down into the data for more detailed analysis, such as clickable charts and expandable tables.
Summary Panels:
High-level overviews of key metrics, providing a quick snapshot of the business's performance.
These components work together to provide a user-friendly and comprehensive view of the business, helping managers and owners make informed decisions.
Summary
By following these steps, you can create a customized dashboard in iVendNext that provides real-time insights and key metrics tailored to your business needs.
Related Articles
Operational Reports
This article provides an overview of the key reports available in iVendNext. It also shows how to create custom reports and explains how to add, remove, and rearrange columns, apply both predefined and custom filters, and sort the data. Introduction ...